
Community listing page, reviews here may not be monitored by the author.
TaskManager


No reviews yet
Configurable Task Manager to check more than just Startup Times, CPU/GPU time and Memory per mod
Community voices
Reviews
No reviews yet. Be the first to review this project!
Get it on
Available Platforms
Compatibility
Supported Environments
Runs entirely on the client. Works on vanilla servers.
About
Project Details
For authors
Embed Badge
If you're the author of this project, you can embed a live badge anywhere that supports HTML or Markdown. It updates automatically whenever ratings change.
Use HTML for any page that supports it, or Markdown for README files and Markdown-based descriptions.
Identifiers
Platform IDs
About
Description
Task Manager
Task Manager is a Fabric client profiler for modded Minecraft that helps you identify frame drops, high MSPT, hot mods, rendering spikes, block-entity pressure, and JVM/runtime issues while the game is still running.
Open the profiler in-game with F12.
Showcase: https://youtu.be/YeJJnLdL9i0
Key Features
- Live per-mod CPU attribution with sampled stack ownership and event invokes shown separately
- Estimated per-mod GPU attribution using render-thread sampling plus measured GPU timer-query time
- Per-mod memory estimates, shared JVM/runtime buckets, and top live class families
- Loader-aware startup timing measured from Fabric entrypoint execution and shown explicitly in
ms - Timeline graphs for frametime, FPS, network throughput, and disk throughput
- World diagnostics with
Lag MapandBlock Entitiesmini-tabs - JVM thread diagnostics, waits/locks, and sensor/runtime health in the System tab
- Session recording and export with summarized worst frame, MSPT spikes, top CPU/GPU/memory mods, hot chunk, and block-entity hotspots
- Optional HUD overlay with configurable sections, layout, position, and trigger mode

Tabs
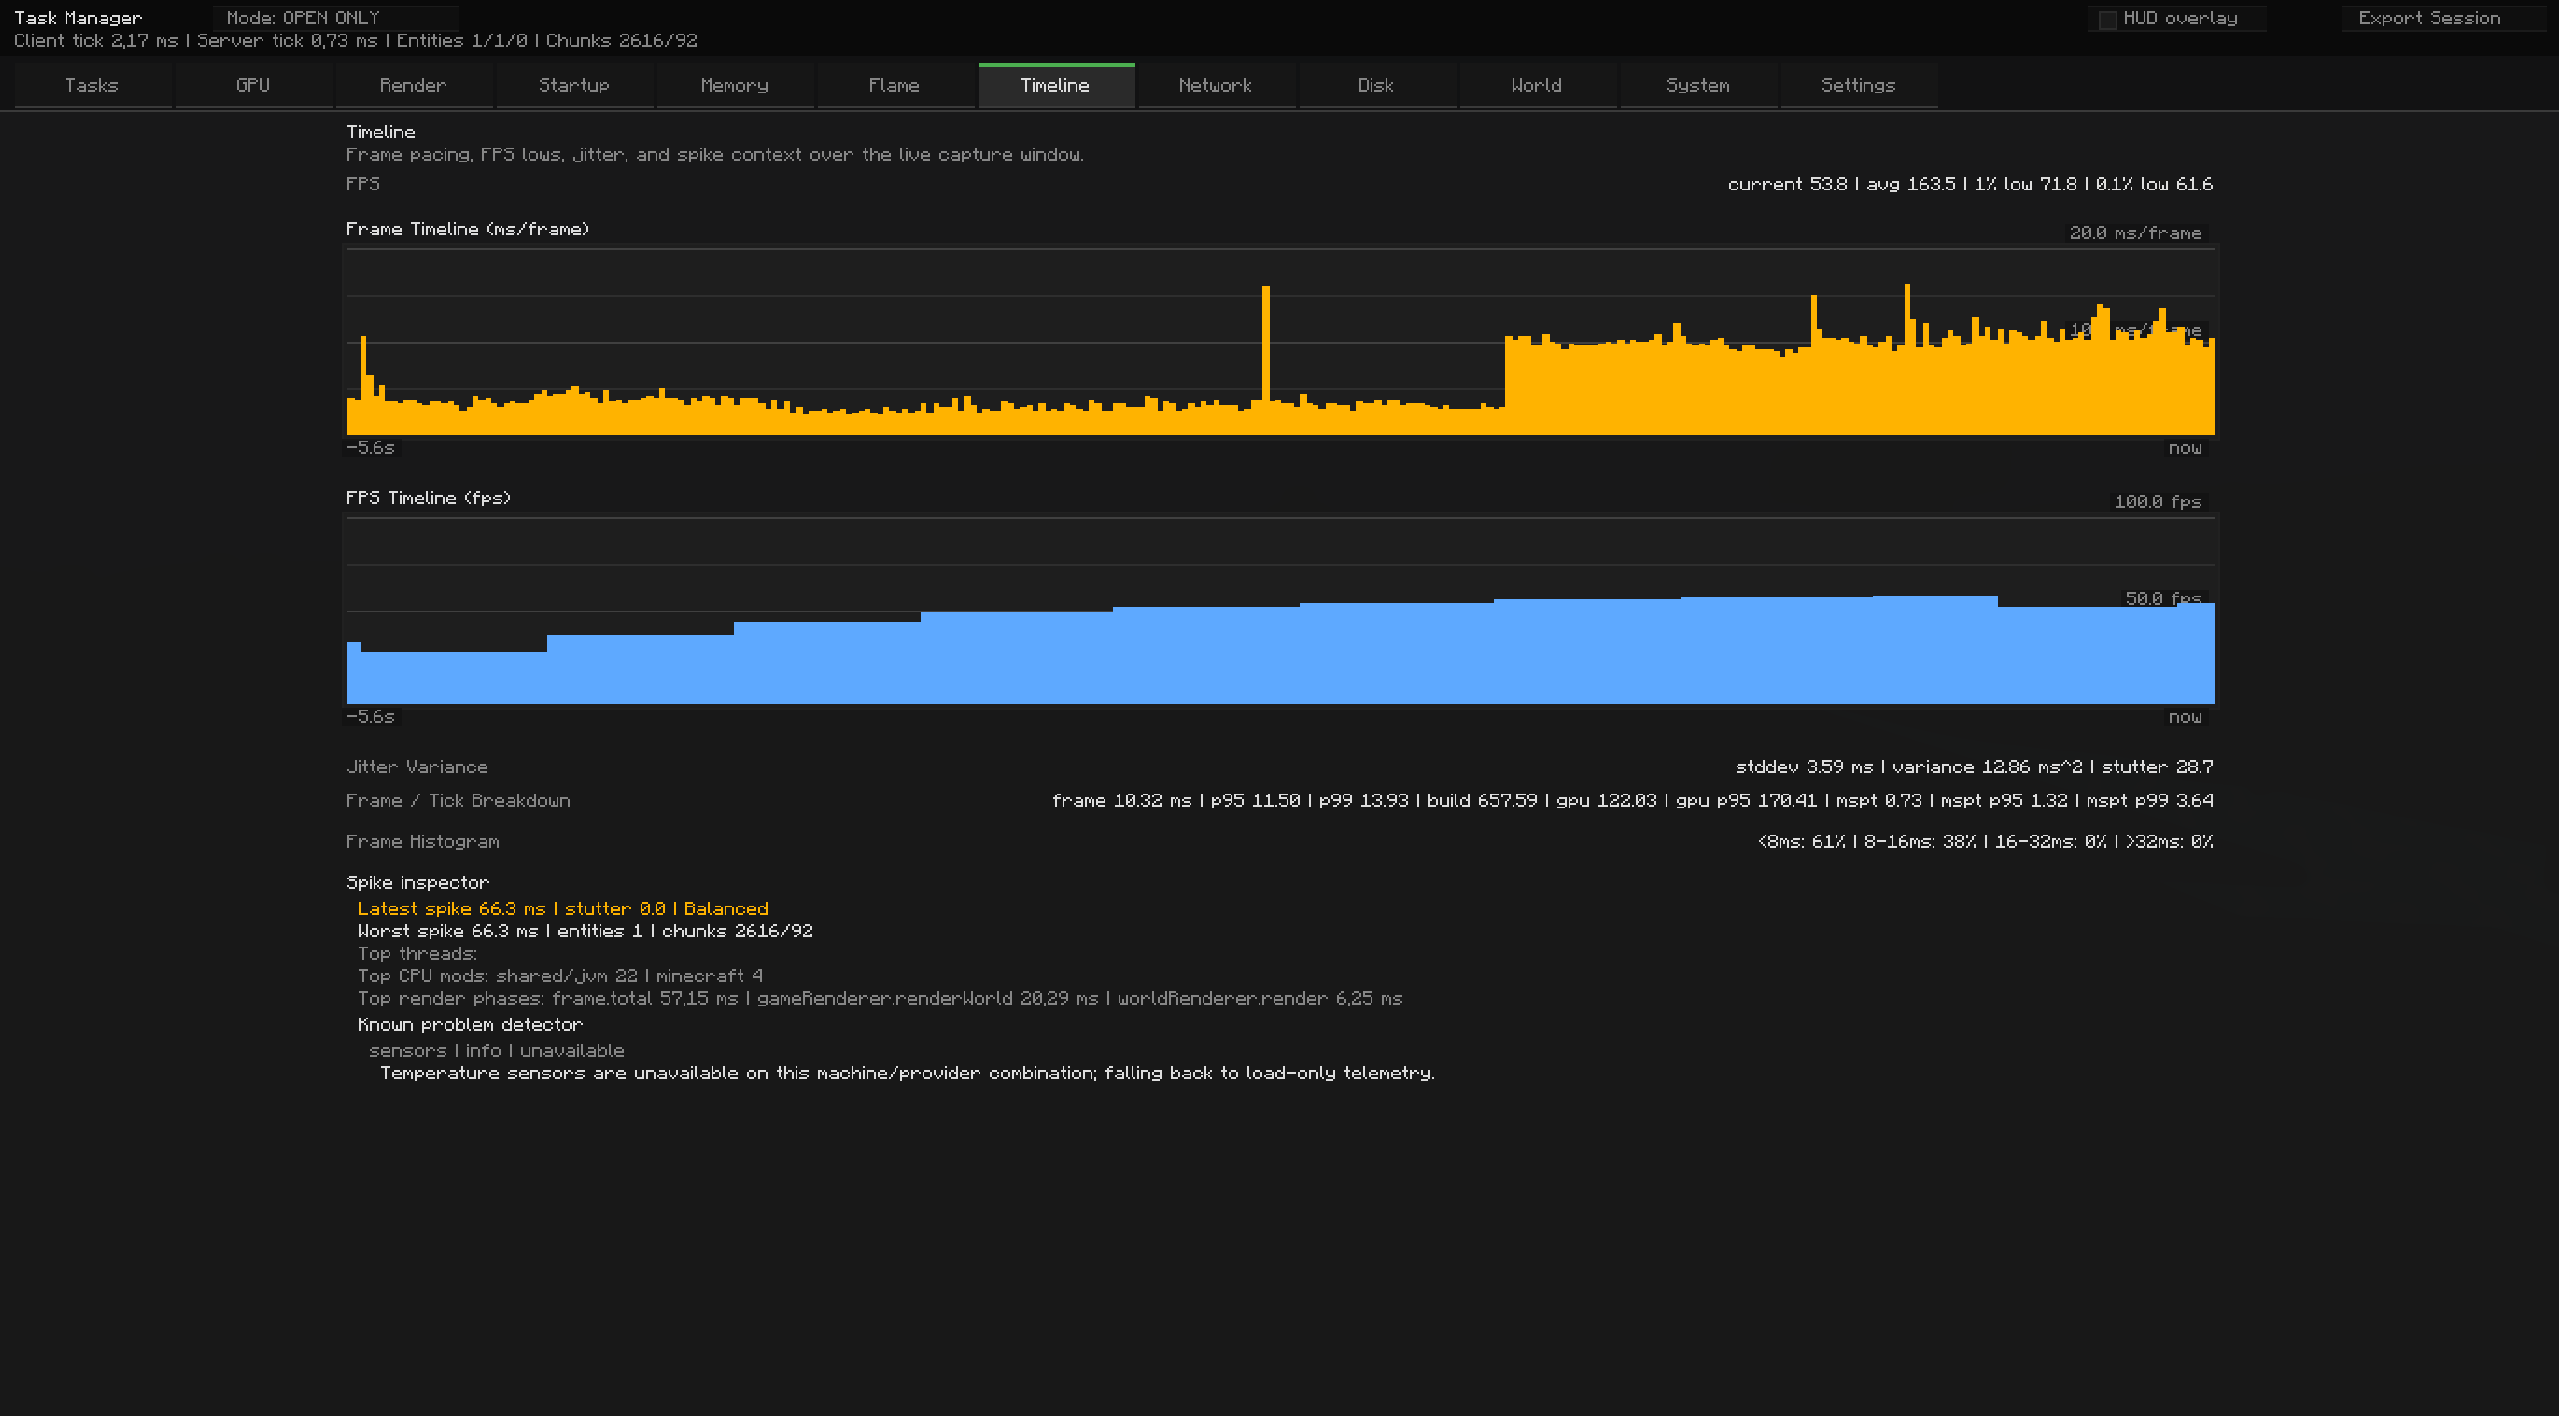
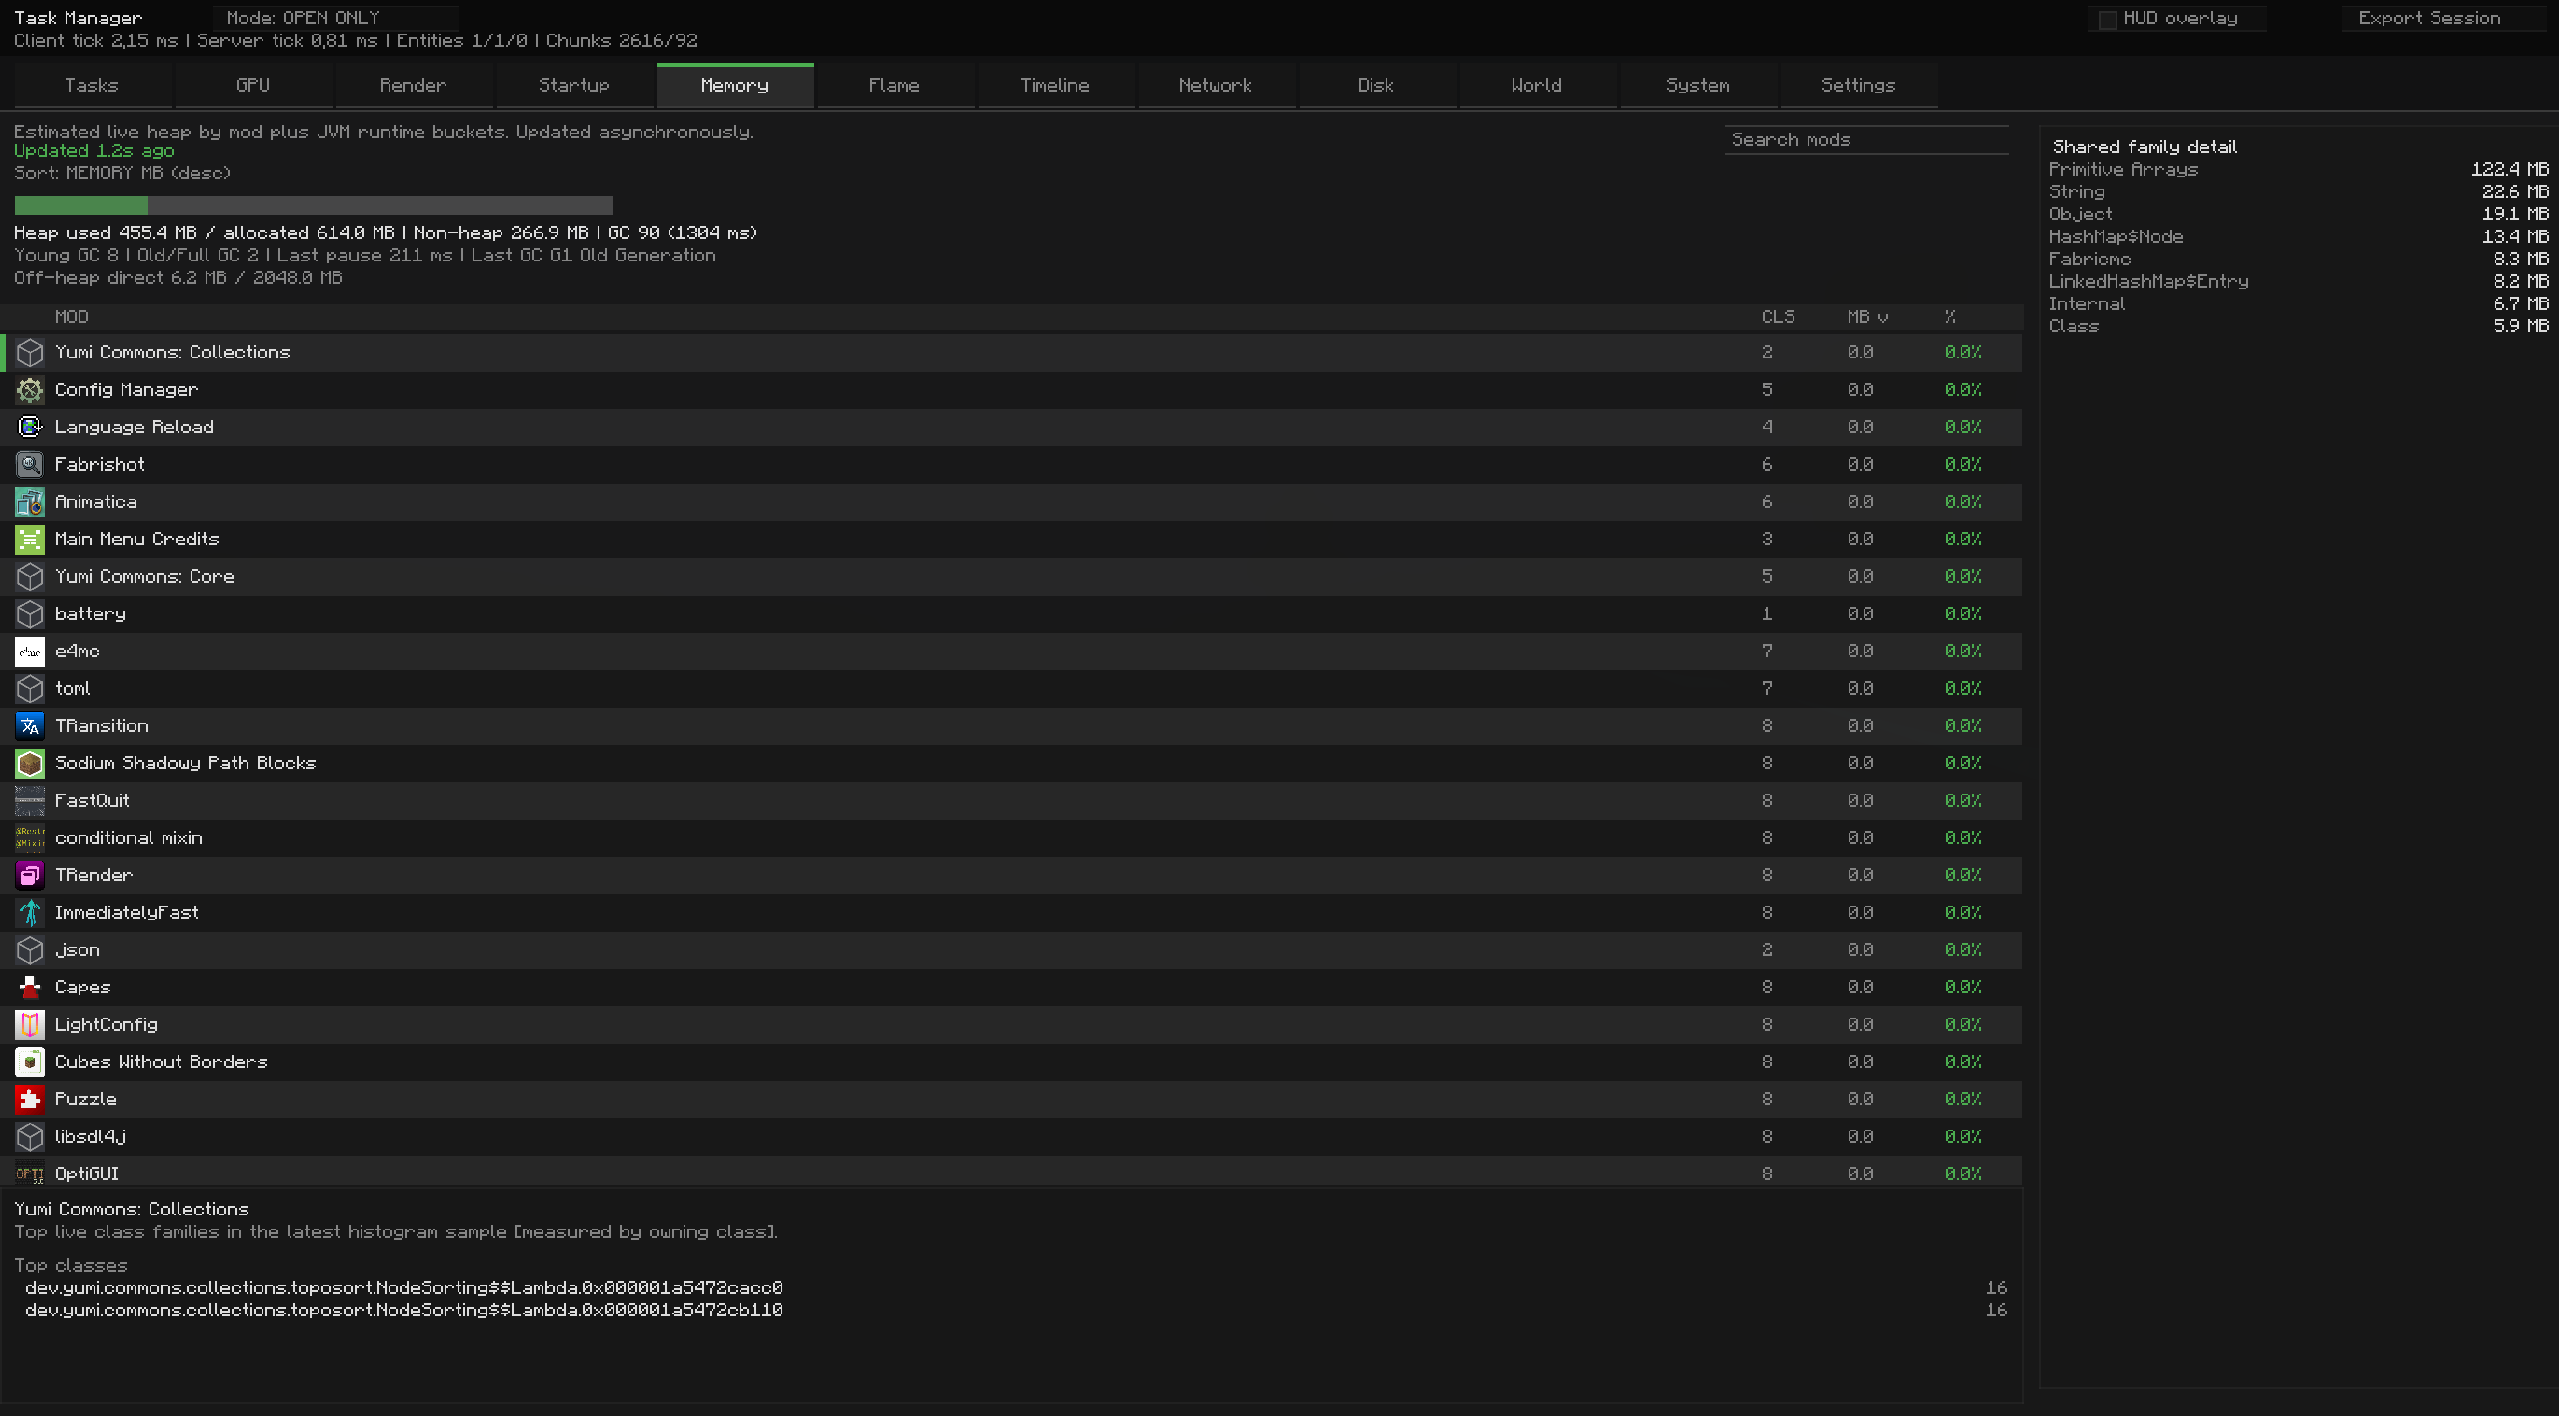
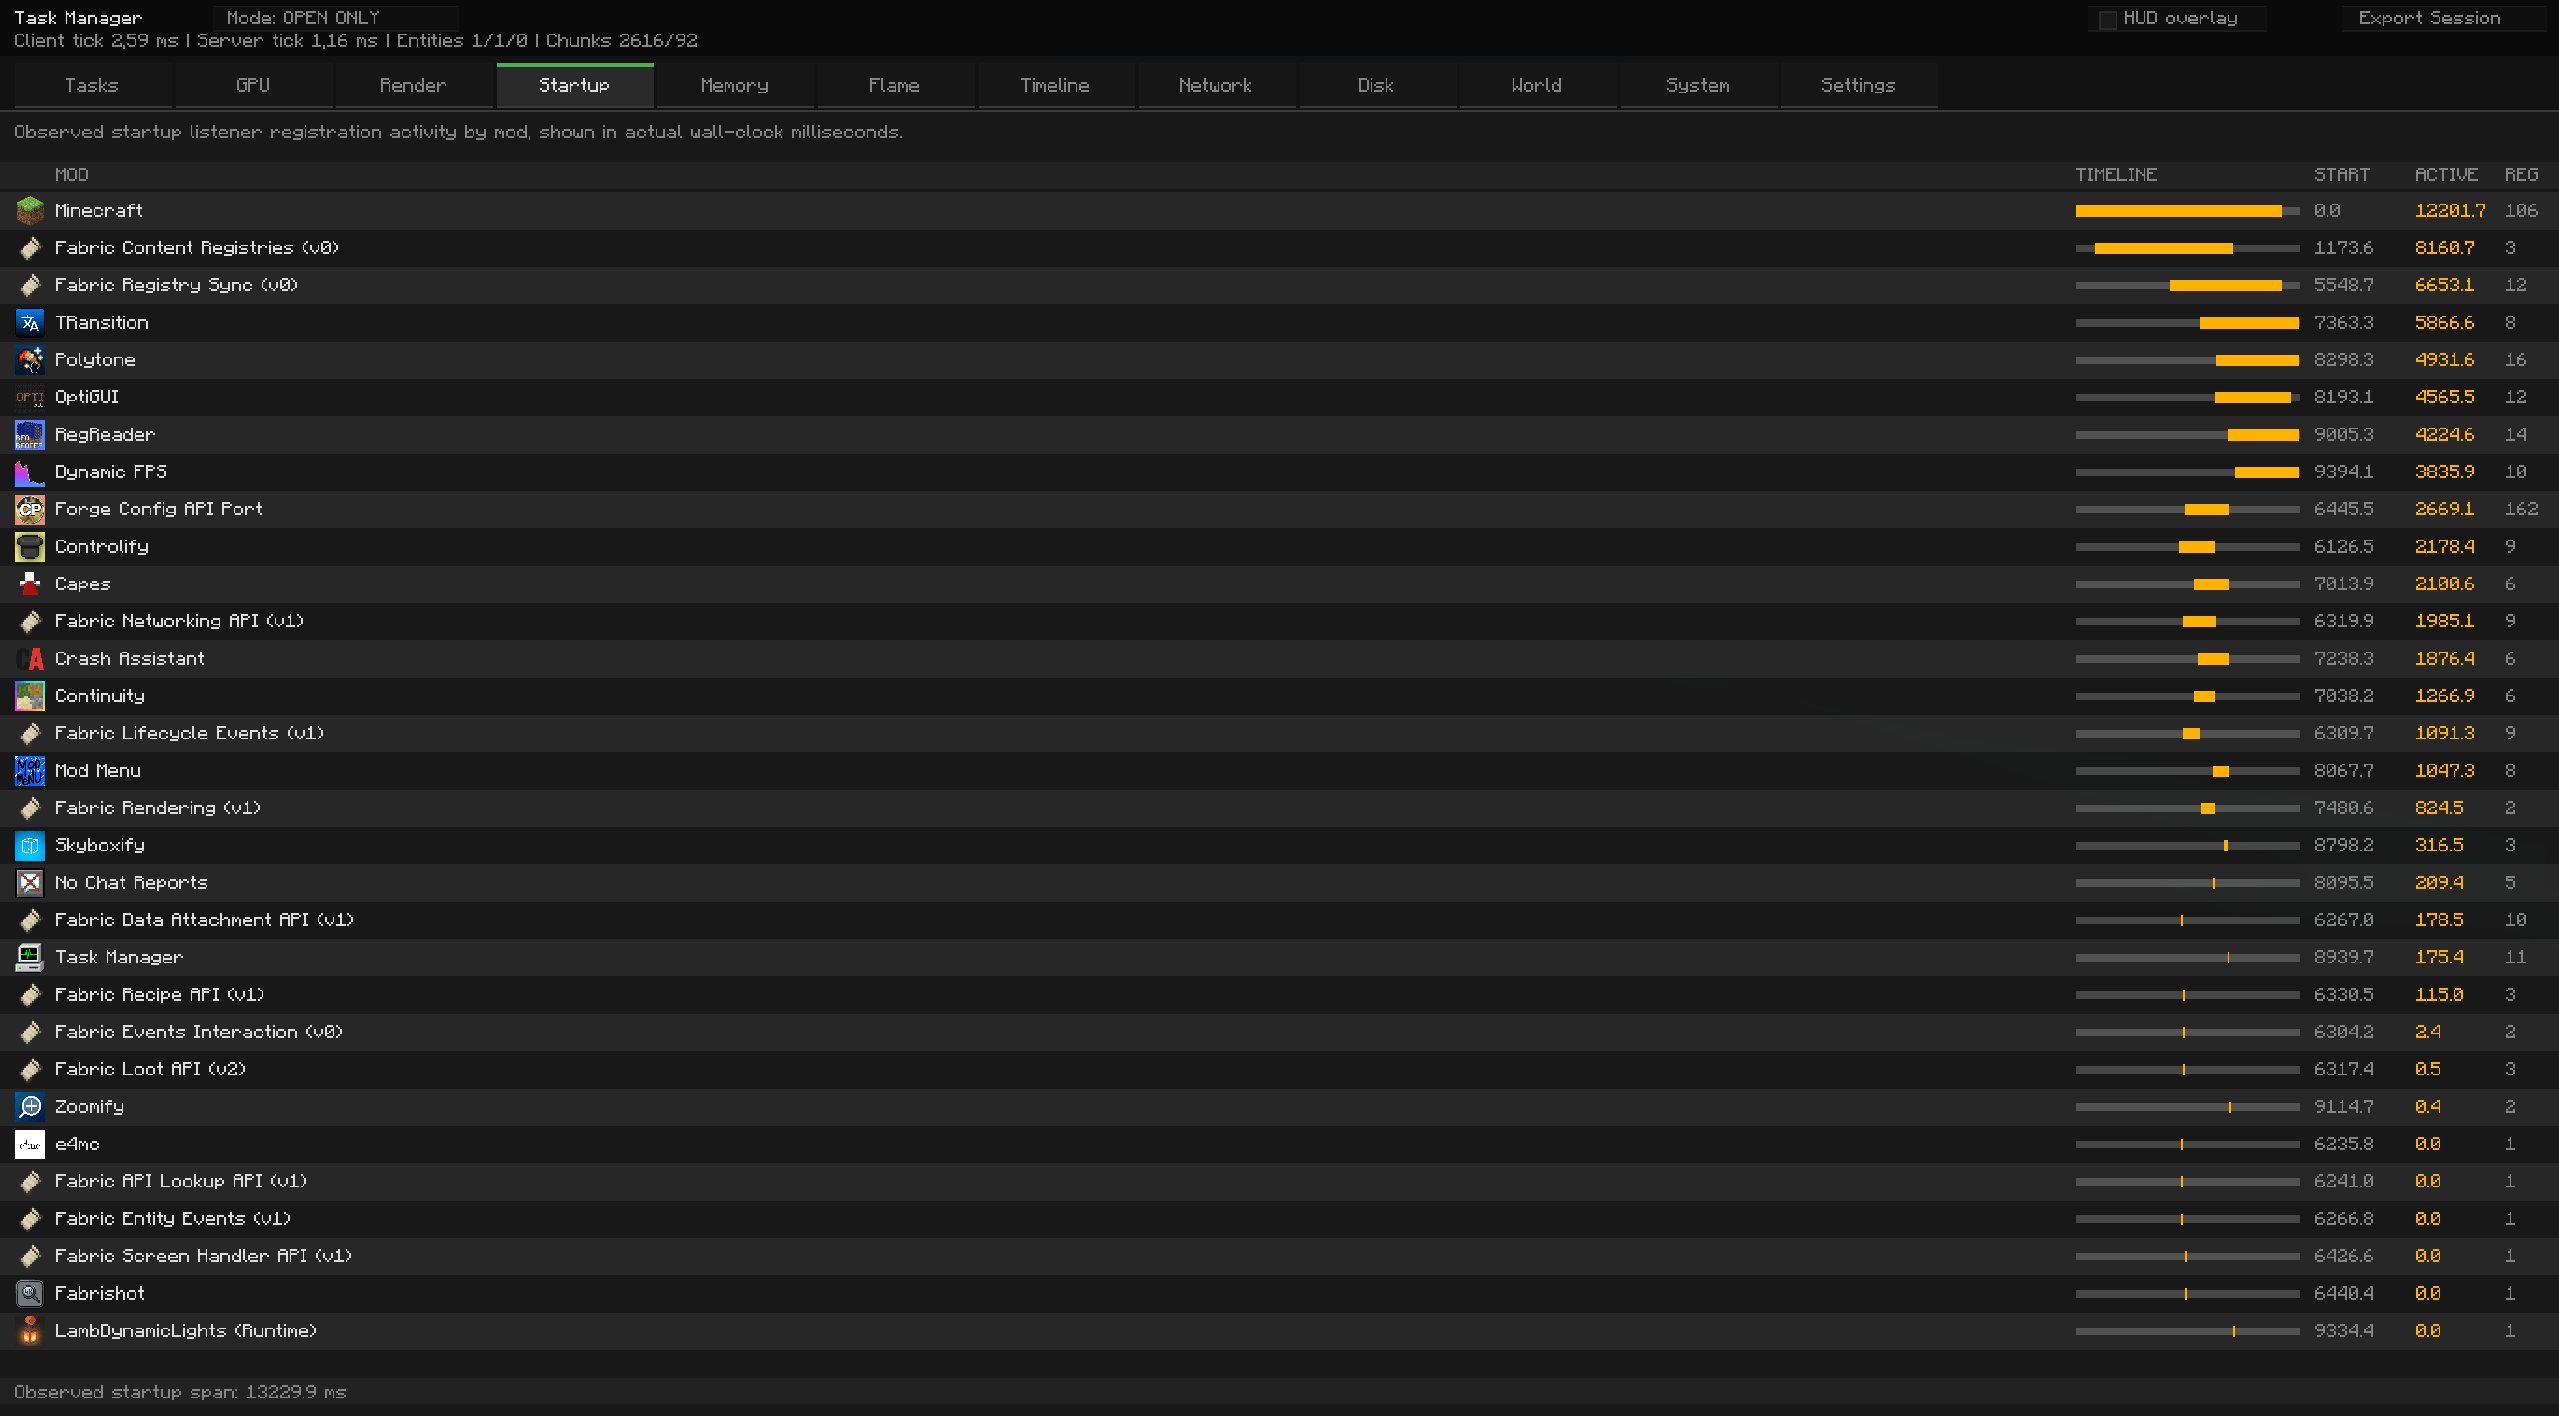
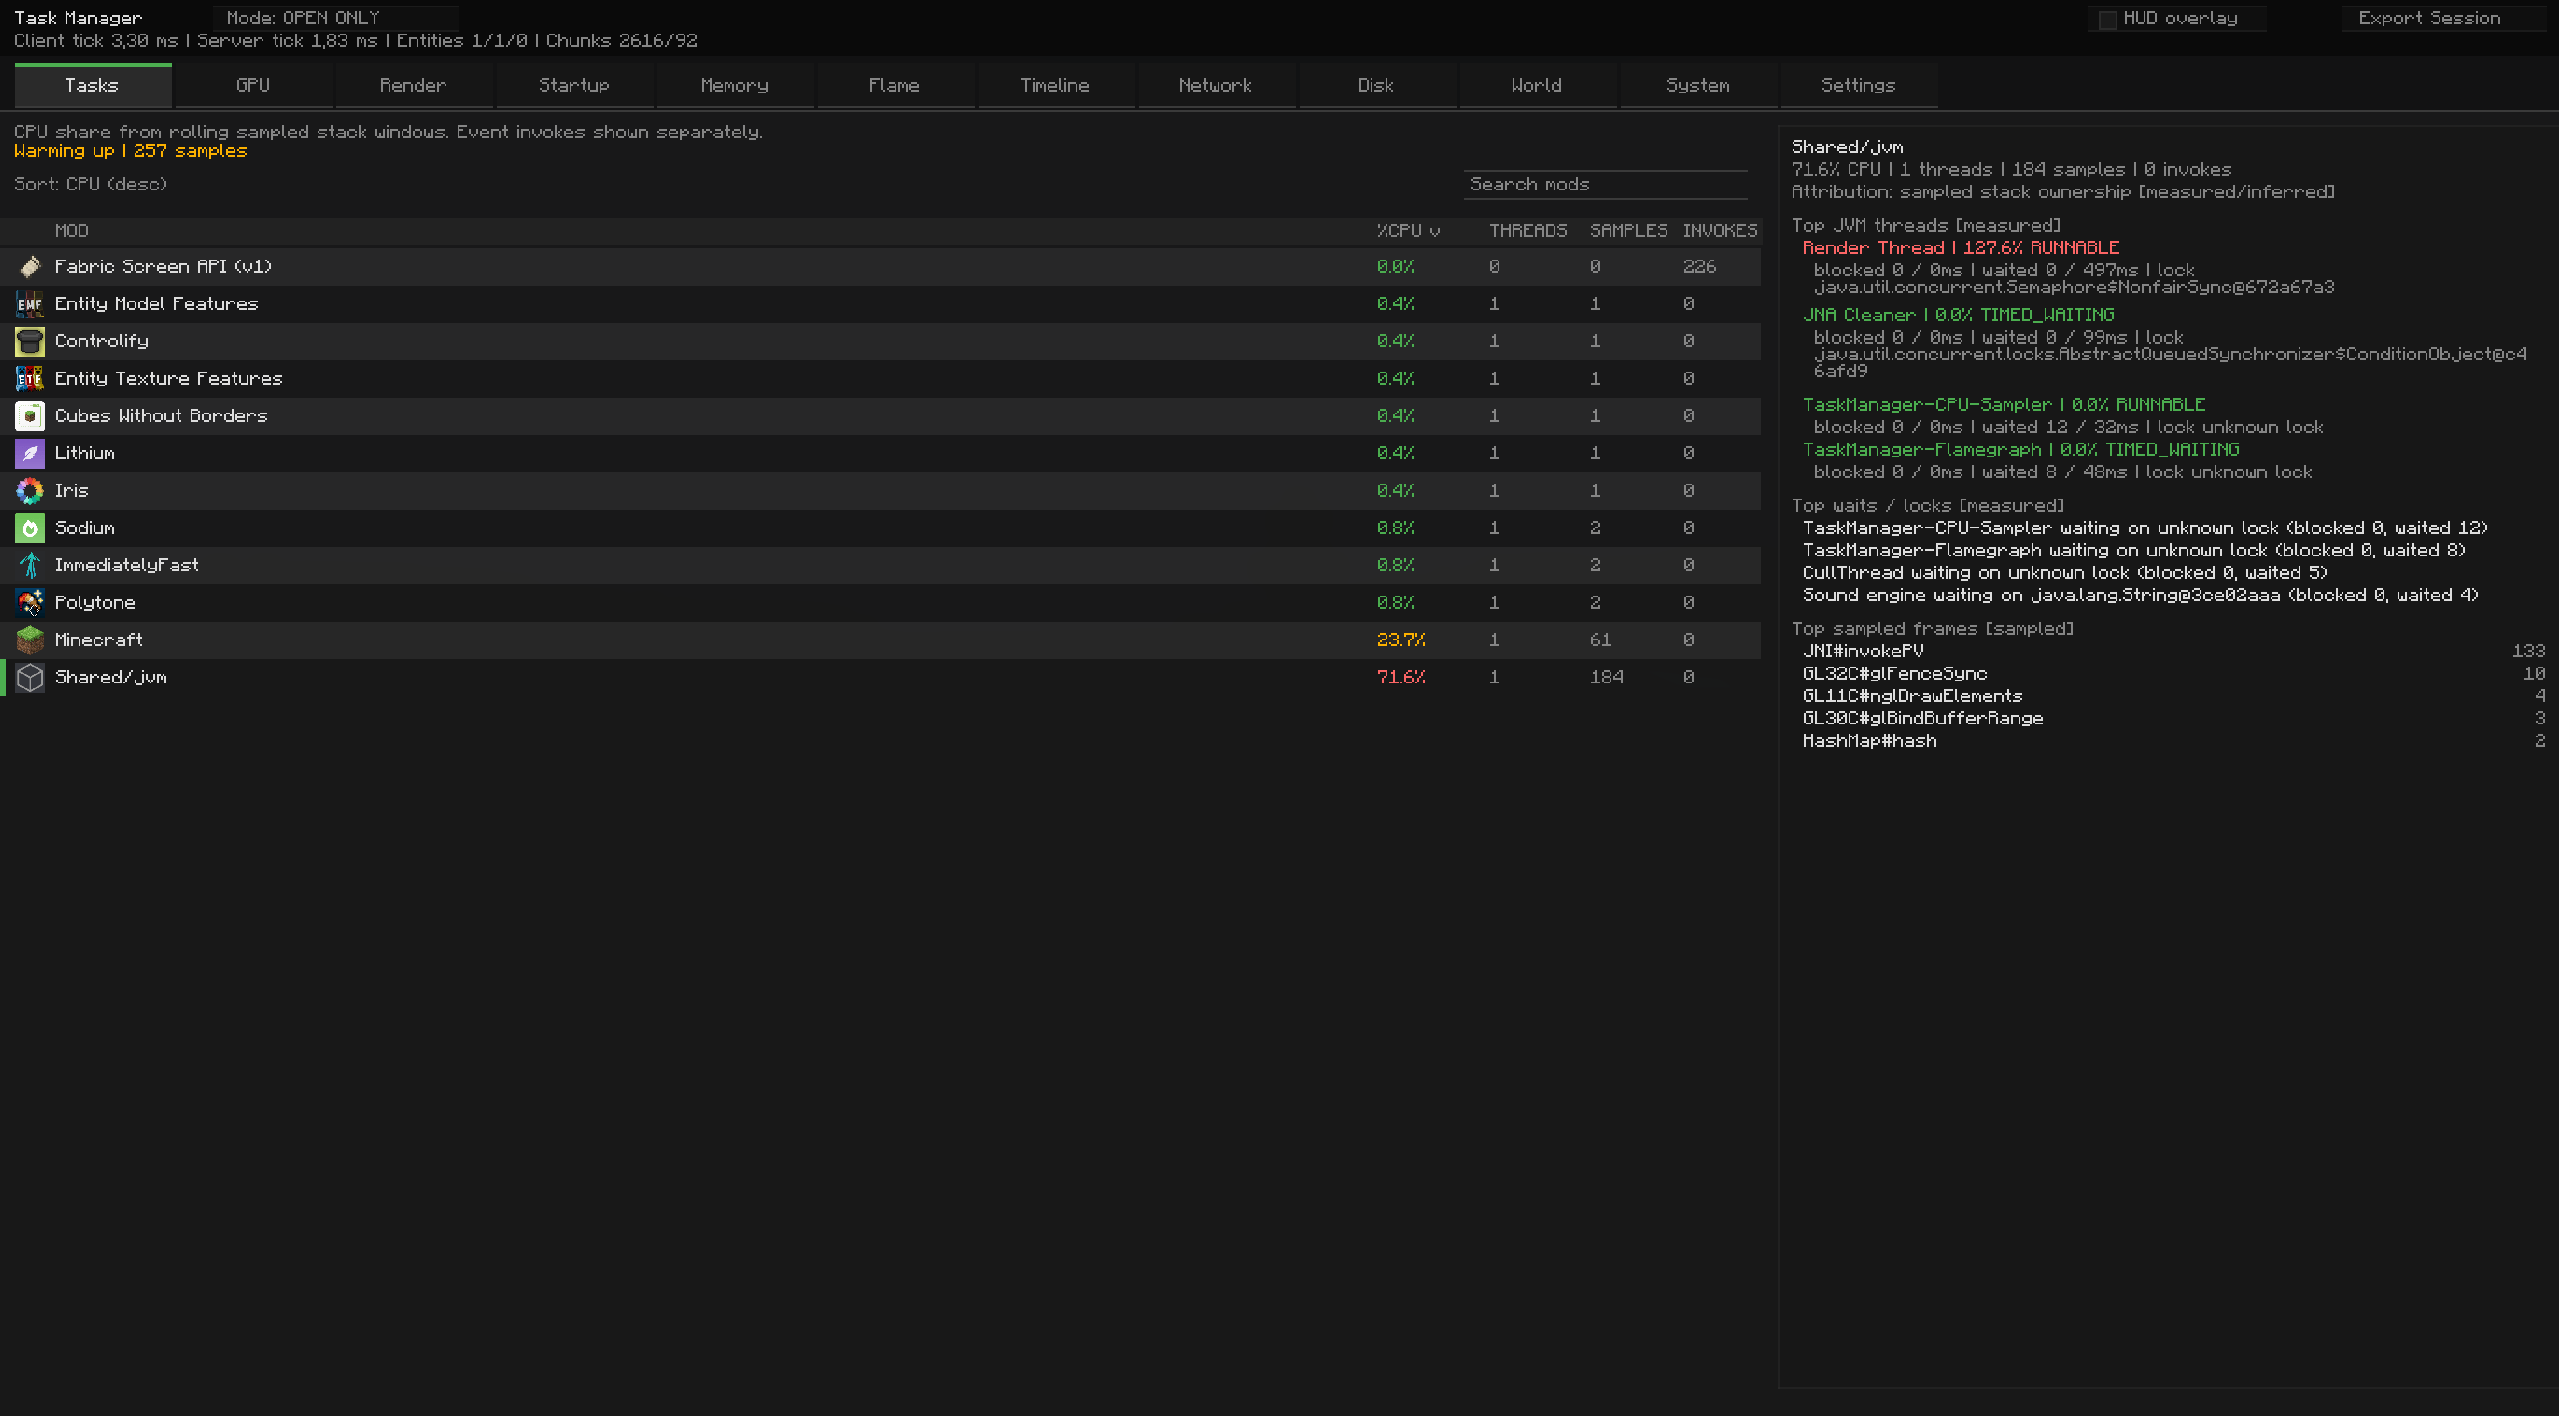
Tasks: per-mod CPU share, sampled threads, sample counts, invokes, filtering, sorting, and row detailGPU: estimated per-mod GPU share, render samples, thread counts, filtering, sorting, and row detailRender: render-phase CPU/GPU timings and call countsStartup: Fabric startup/entrypoint timing by mod in explicit millisecondsMemory: per-mod heap estimates, shared JVM buckets, top classes, filtering, sorting, and shared-family drilldownFlame: sampled stack/flame-style hotspot viewTimeline: frametime, FPS, jitter, variance, frame percentiles, GPU frame time, and MSPT overviewNetwork: inbound/outbound throughput graphs plus packet/category breakdownsDisk: disk read/write throughput graphsWorld: lag map, hot chunks, entity hotspots, and block-entity drilldownSystem: CPU/GPU load, temperatures, thread load, waits/locks, sensors, and runtime diagnosticsSettings: session options, HUD options, and configurable table column visibility


Controls
F12: open Task ManagerF11: start/stop session recordingF10: toggle HUD overlay
All keybinds can also be changed in Minecraft controls.
Searching, Sorting, and Columns
Tasks, GPU, and Memory support:
- typed search/filter boxes
- clickable sortable columns
- configurable column visibility from the
Settingstab
Sessions and Export
Session exports include a polished summary with:
- worst frame
- worst MSPT spike
- top CPU mods
- top GPU mods
- top memory mods
- hot chunk summary
- block entity classes
- rule findings and sensor diagnostics
Notes on Accuracy
Task Manager aims to be honest about what is measured versus estimated:
- CPU attribution is based on sampled stack ownership
- GPU attribution is estimated from render-thread samples weighted by GPU timer-query time
- Memory attribution is based on JVM/class-histogram style ownership and shared runtime buckets
- Temperatures and some system metrics depend on what the platform or an external sensor provider exposes
That means the profiler is very useful for finding hotspots and spikes, but some values, especially GPU-per-mod and shared JVM memory, should be interpreted as guidance rather than perfect ground truth.
Task Manager
Task Manager is a Fabric client profiler for modded Minecraft that helps you identify frame drops, high MSPT, hot mods, rendering spikes, block-entity pressure, and JVM/runtime issues while the game is still running.
Open the profiler in-game with F12.
Key Features
- Live per-mod CPU attribution with sampled stack ownership and event invokes shown separately
- Estimated per-mod GPU attribution using render-thread sampling plus measured GPU timer-query time
- Per-mod memory estimates, shared JVM/runtime buckets, and top live class families
- Loader-aware startup timing measured from Fabric entrypoint execution and shown explicitly in
ms - Timeline graphs for frametime, FPS, network throughput, and disk throughput
- World diagnostics with
Lag MapandBlock Entitiesmini-tabs - JVM thread diagnostics, waits/locks, and sensor/runtime health in the System tab
- Session recording and export with summarized worst frame, MSPT spikes, top CPU/GPU/memory mods, hot chunk, and block-entity hotspots
- Optional HUD overlay with configurable sections, layout, position, and trigger mode
Tabs
Tasks: per-mod CPU share, sampled threads, sample counts, invokes, filtering, sorting, and row detailGPU: estimated per-mod GPU share, render samples, thread counts, filtering, sorting, and row detailRender: render-phase CPU/GPU timings and call countsStartup: Fabric startup/entrypoint timing by mod in explicit millisecondsMemory: per-mod heap estimates, shared JVM buckets, top classes, filtering, sorting, and shared-family drilldownFlame: sampled stack/flame-style hotspot viewTimeline: frametime, FPS, jitter, variance, frame percentiles, GPU frame time, and MSPT overviewNetwork: inbound/outbound throughput graphs plus packet/category breakdownsDisk: disk read/write throughput graphsWorld: lag map, hot chunks, entity hotspots, and block-entity drilldownSystem: CPU/GPU load, temperatures, thread load, waits/locks, sensors, and runtime diagnosticsSettings: session options, HUD options, and configurable table column visibility
Controls
F12: open Task ManagerF11: start/stop session recordingF10: toggle HUD overlay
All keybinds can also be changed in Minecraft controls.
Searching, Sorting, and Columns
Tasks, GPU, and Memory support:
- typed search/filter boxes
- clickable sortable columns
- configurable column visibility from the
Settingstab
Sessions and Export
Session exports include a polished summary with:
- worst frame
- worst MSPT spike
- top CPU mods
- top GPU mods
- top memory mods
- hot chunk summary
- block entity classes
- rule findings and sensor diagnostics
Notes on Accuracy
Task Manager aims to be honest about what is measured versus estimated:
- CPU attribution is based on sampled stack ownership
- GPU attribution is estimated from render-thread samples weighted by GPU timer-query time
- Memory attribution is based on JVM/class-histogram style ownership and shared runtime buckets
- Temperatures and some system metrics depend on what the platform or an external sensor provider exposes
That means the profiler is very useful for finding hotspots and spikes, but some values, especially GPU-per-mod and shared JVM memory, should be interpreted as guidance rather than perfect ground truth.
Screenshots
Gallery
-
 Screenshot 2026-03-09 192537.png Screenshot 2026-03-09 192537.png
 -
 Screenshot 2026-03-09 192528.png Screenshot 2026-03-09 192528.png
 -
 Screenshot 2026-03-09 192514.png Screenshot 2026-03-09 192514.png
 -
 Screenshot 2026-03-09 192504.png Screenshot 2026-03-09 192504.png
-
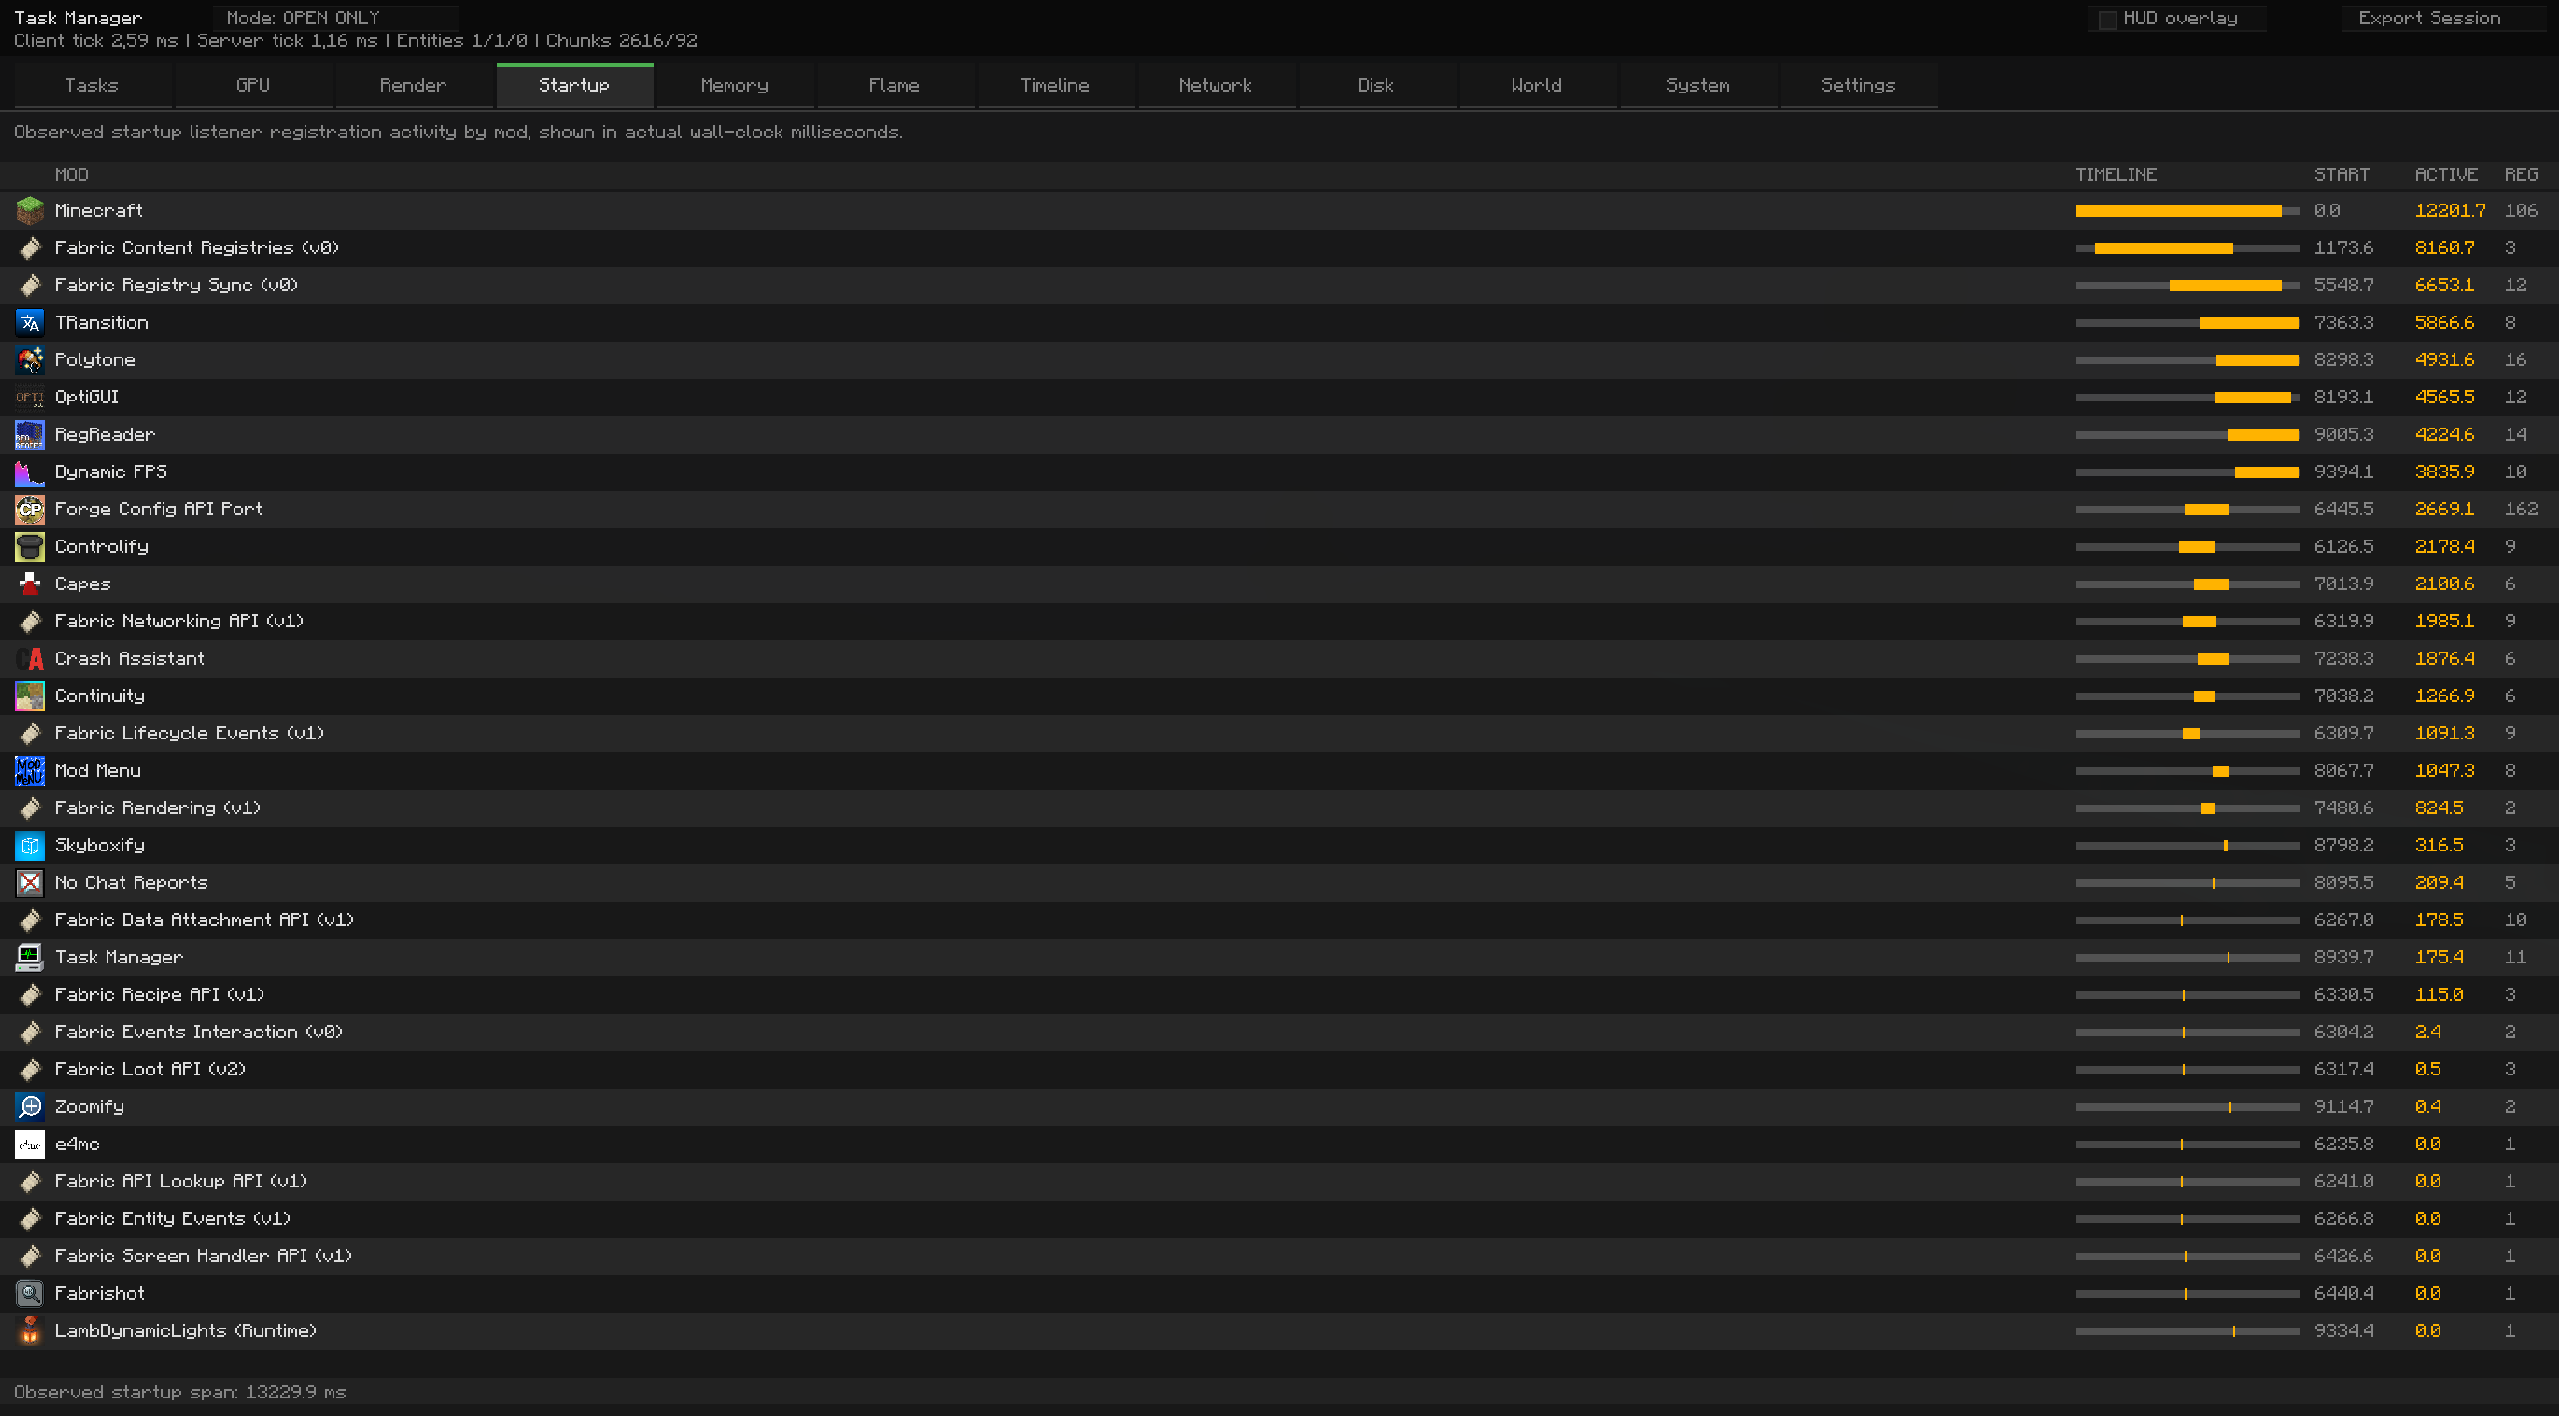 Task Manager Startup Timings
 -
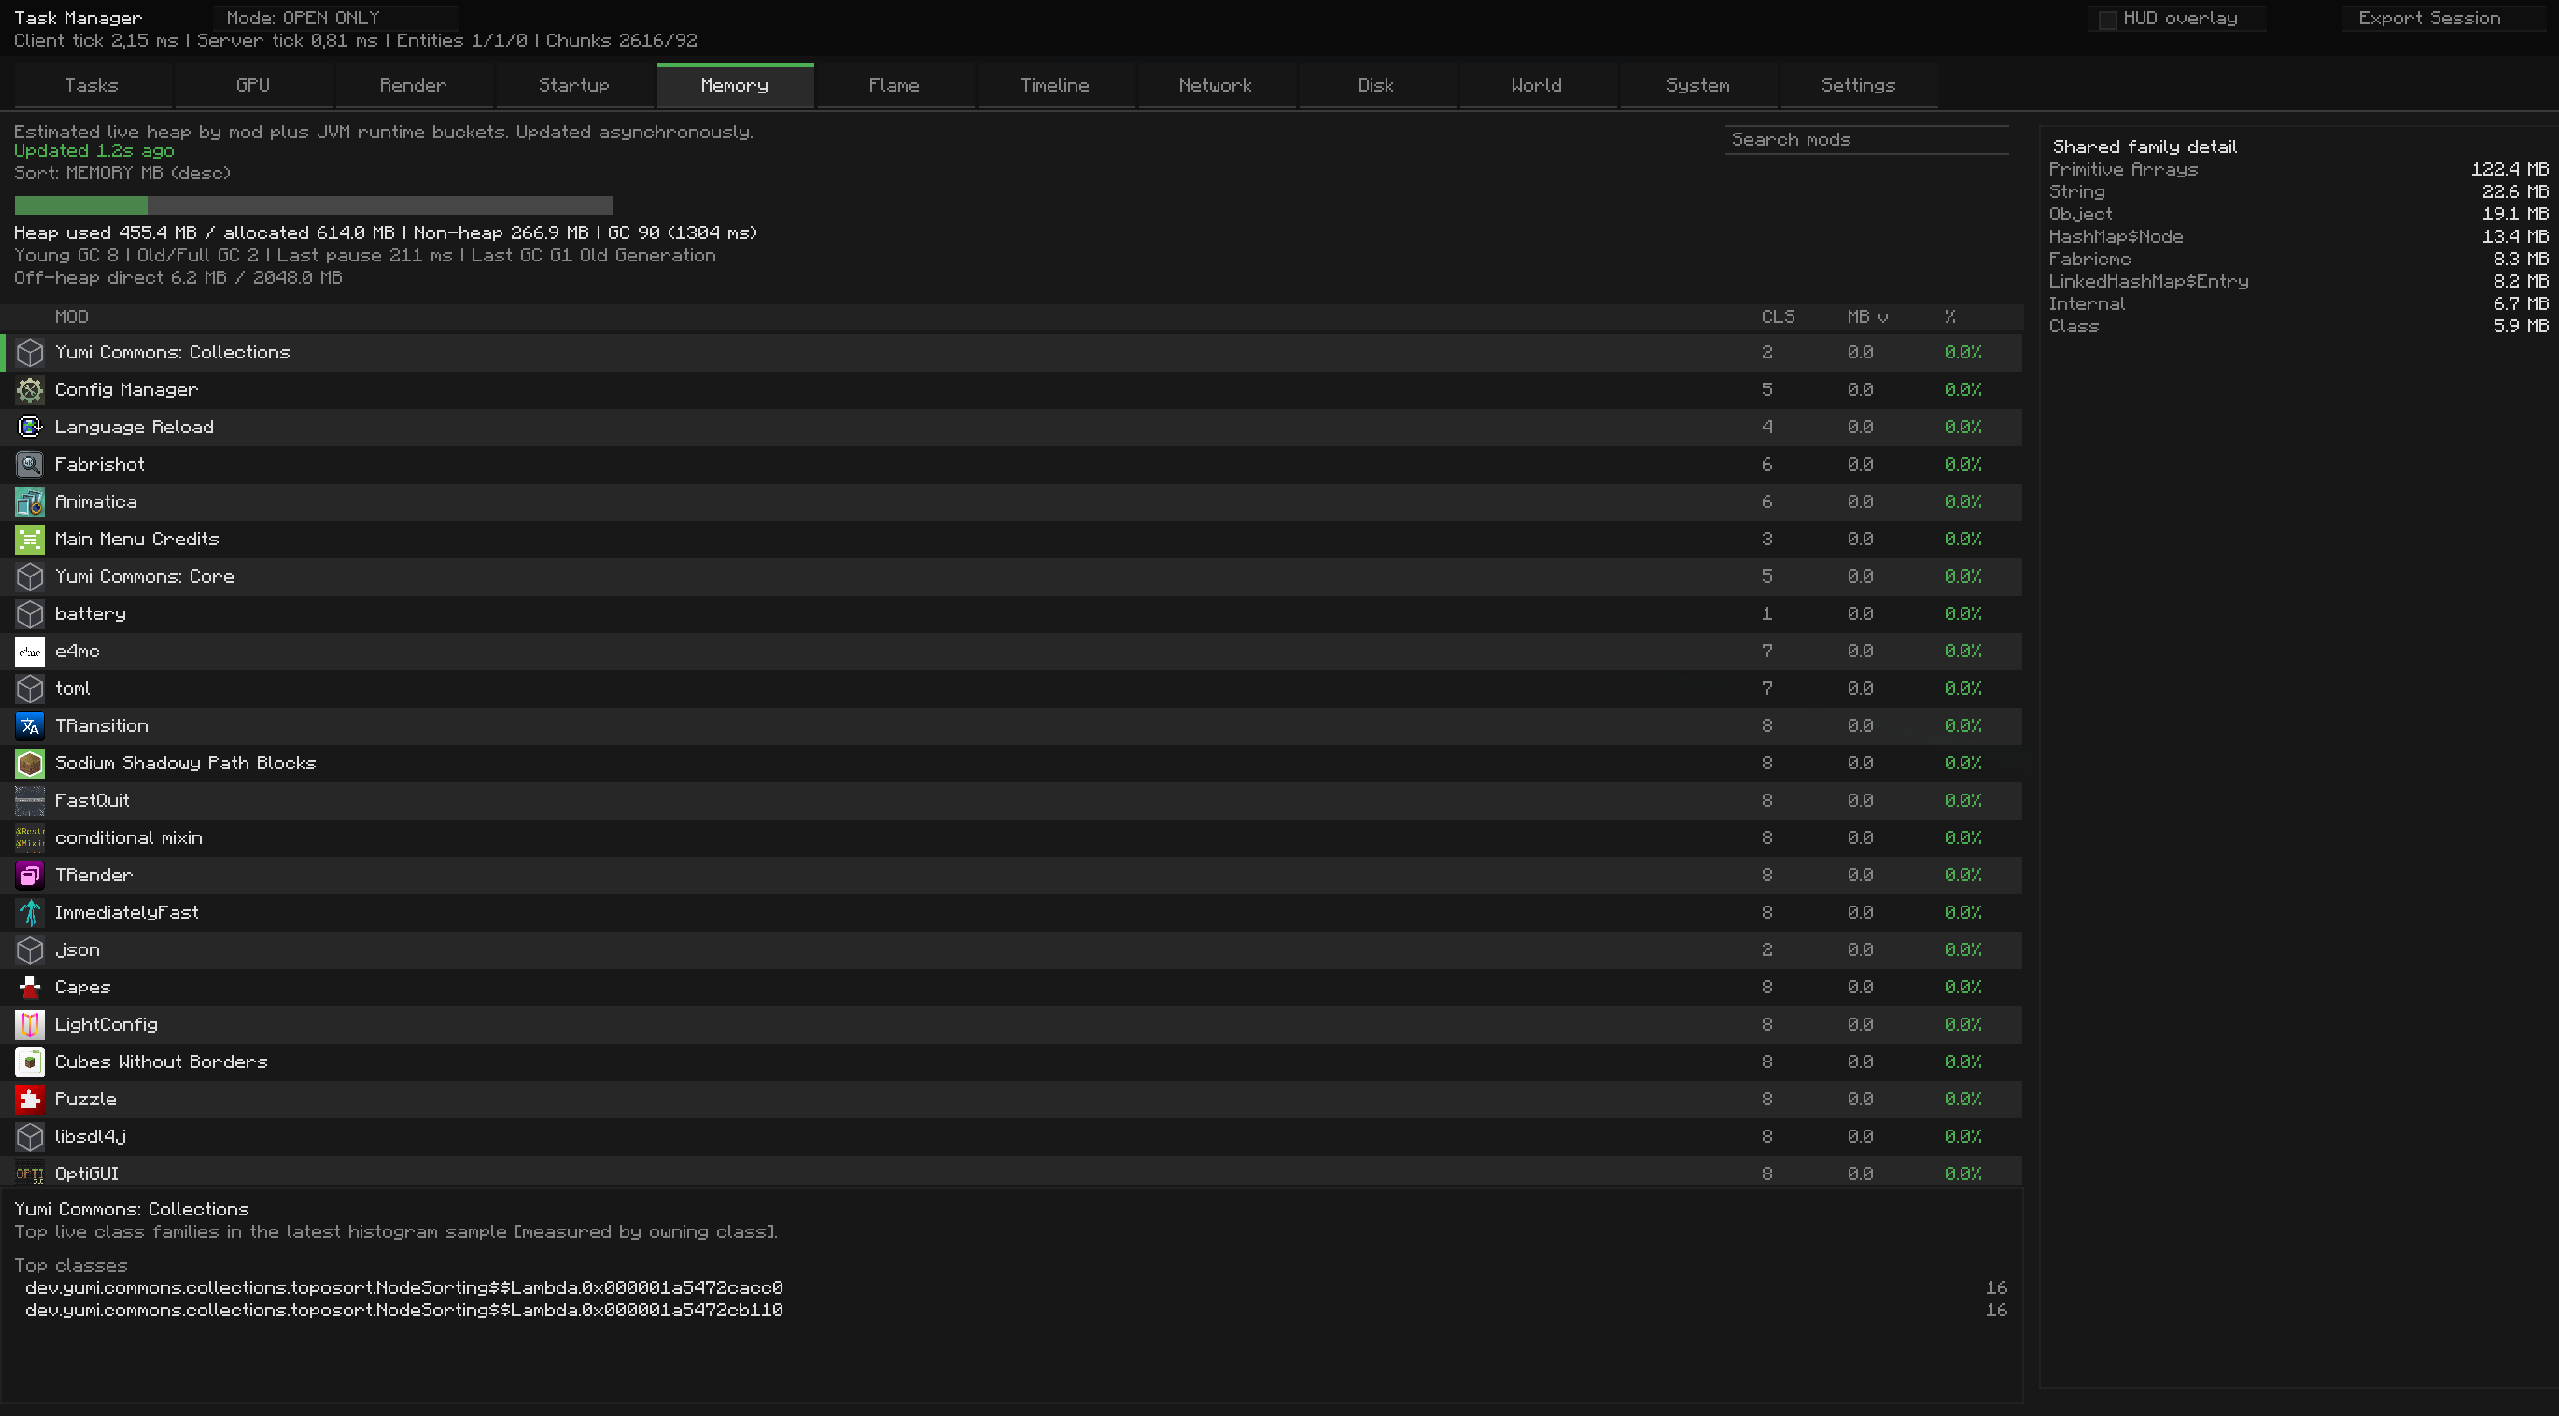 Task Manager Memory Explorer
 -
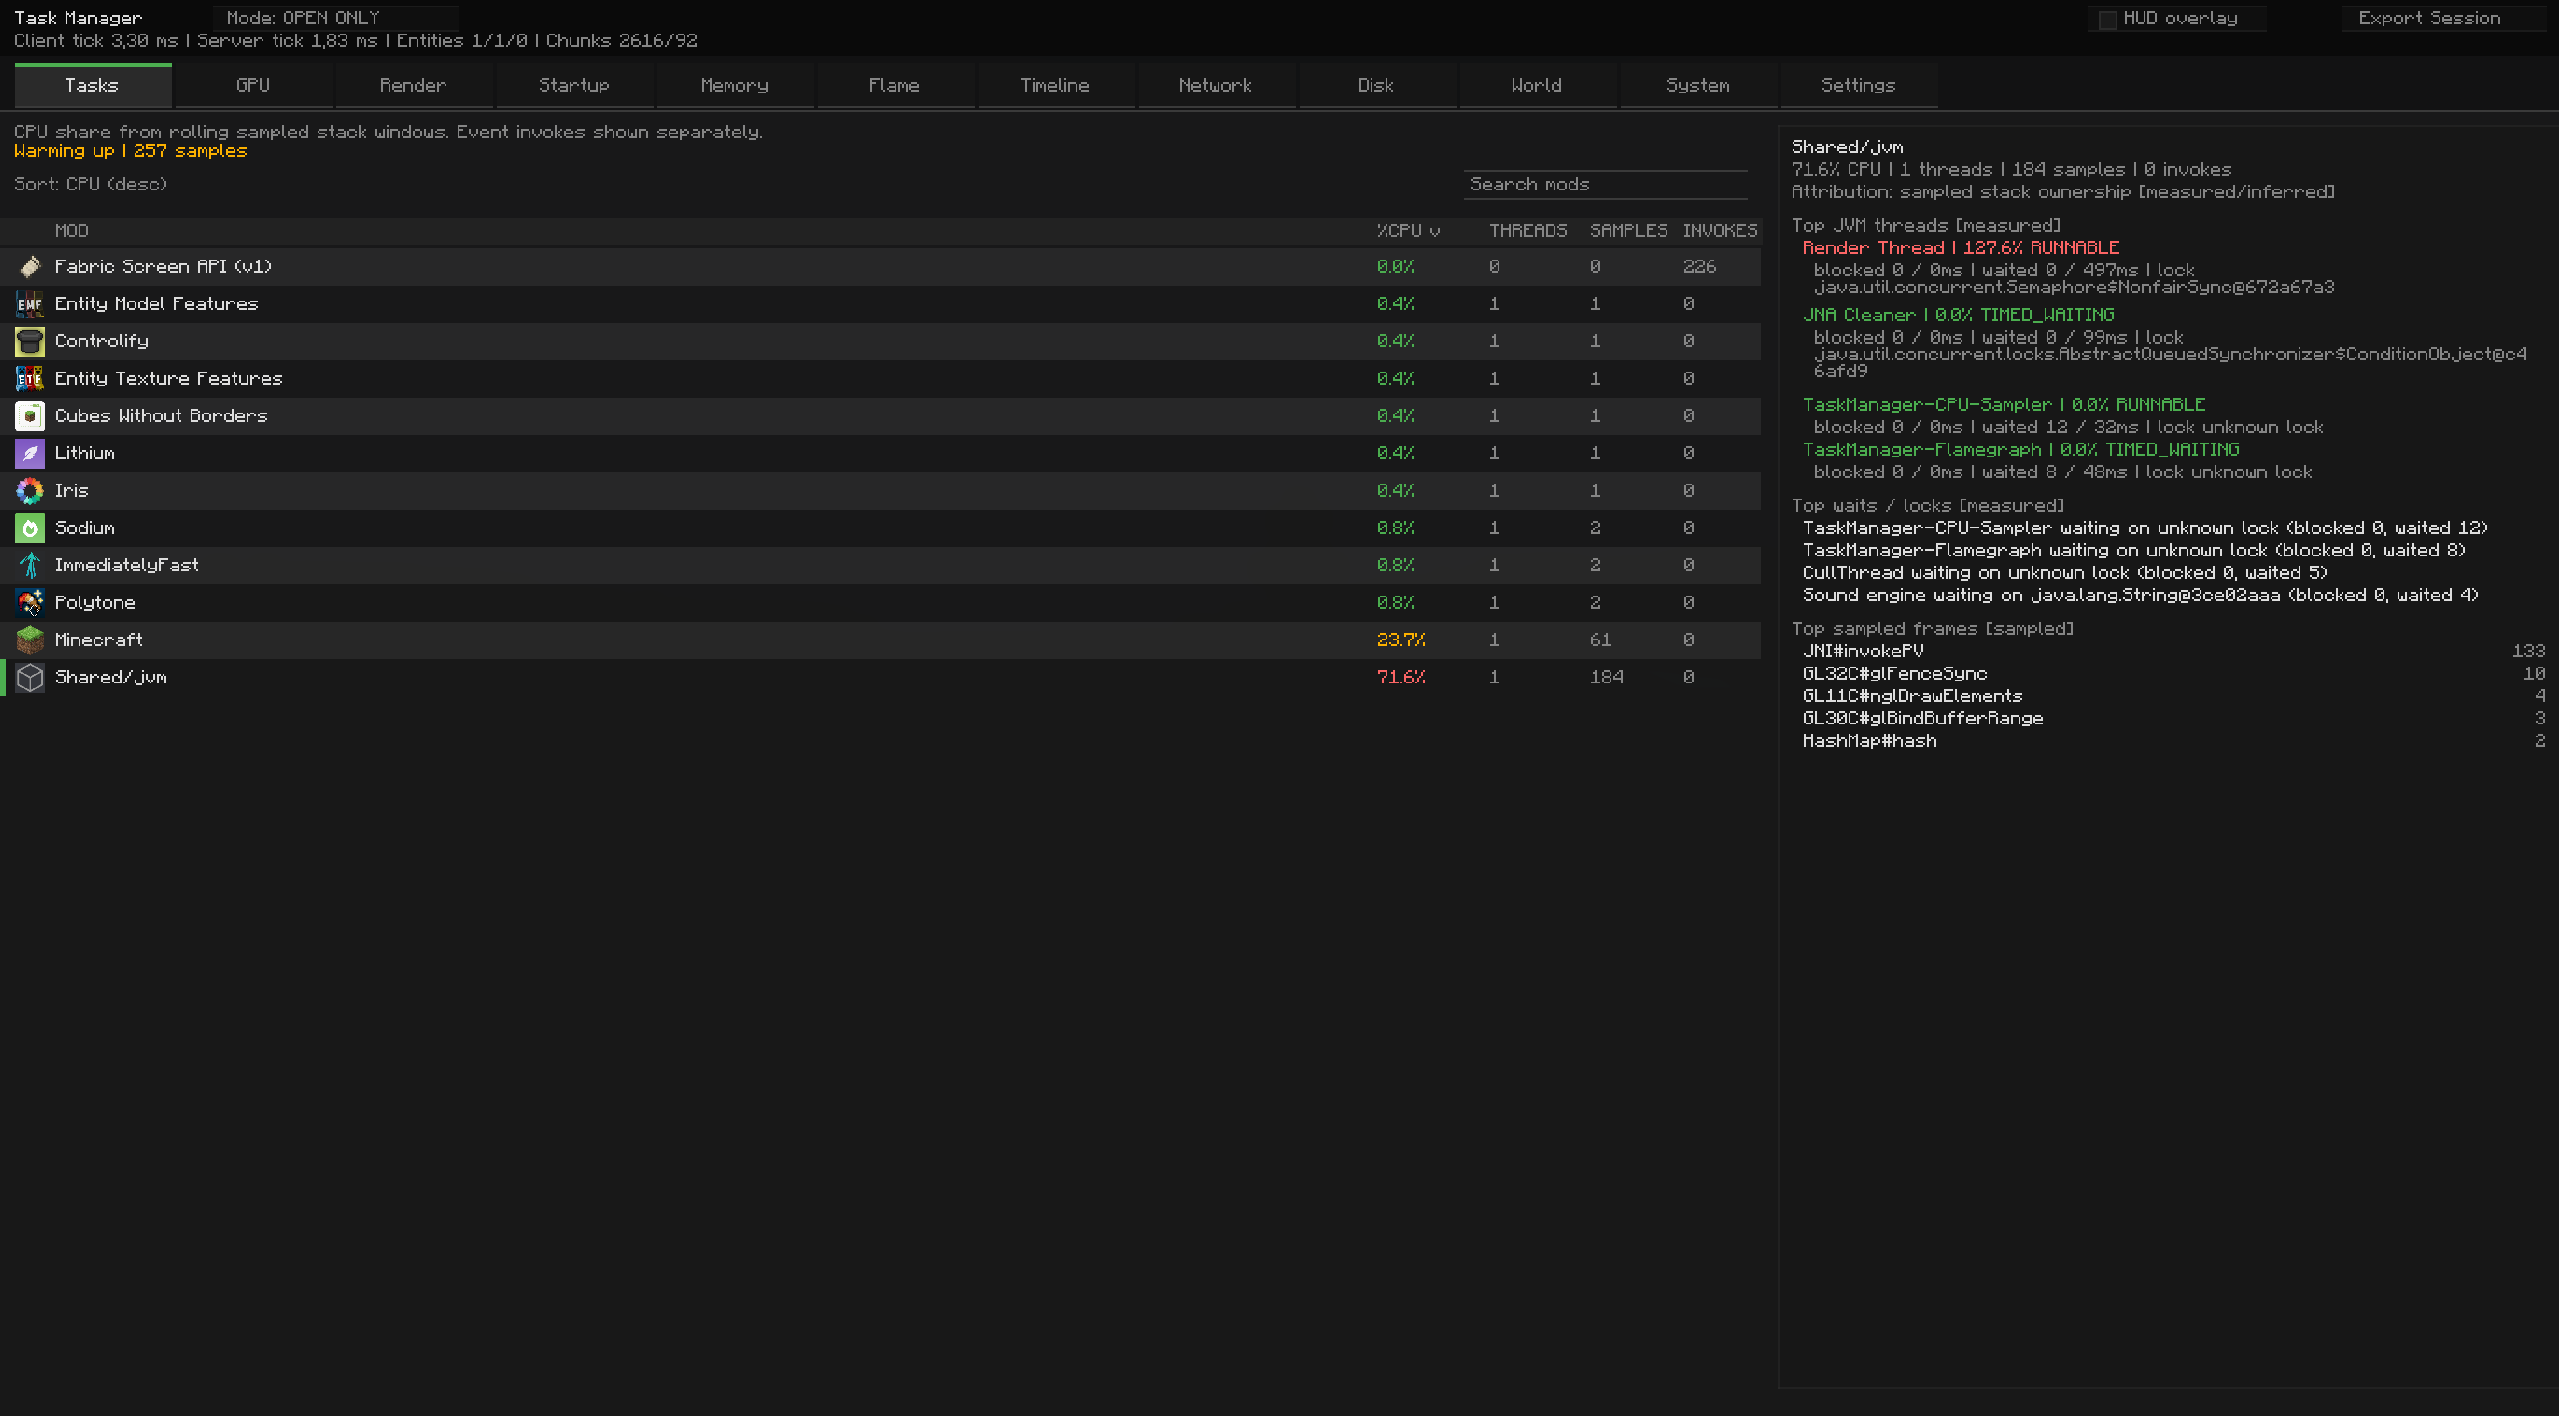 Task Manager Tasks
 -
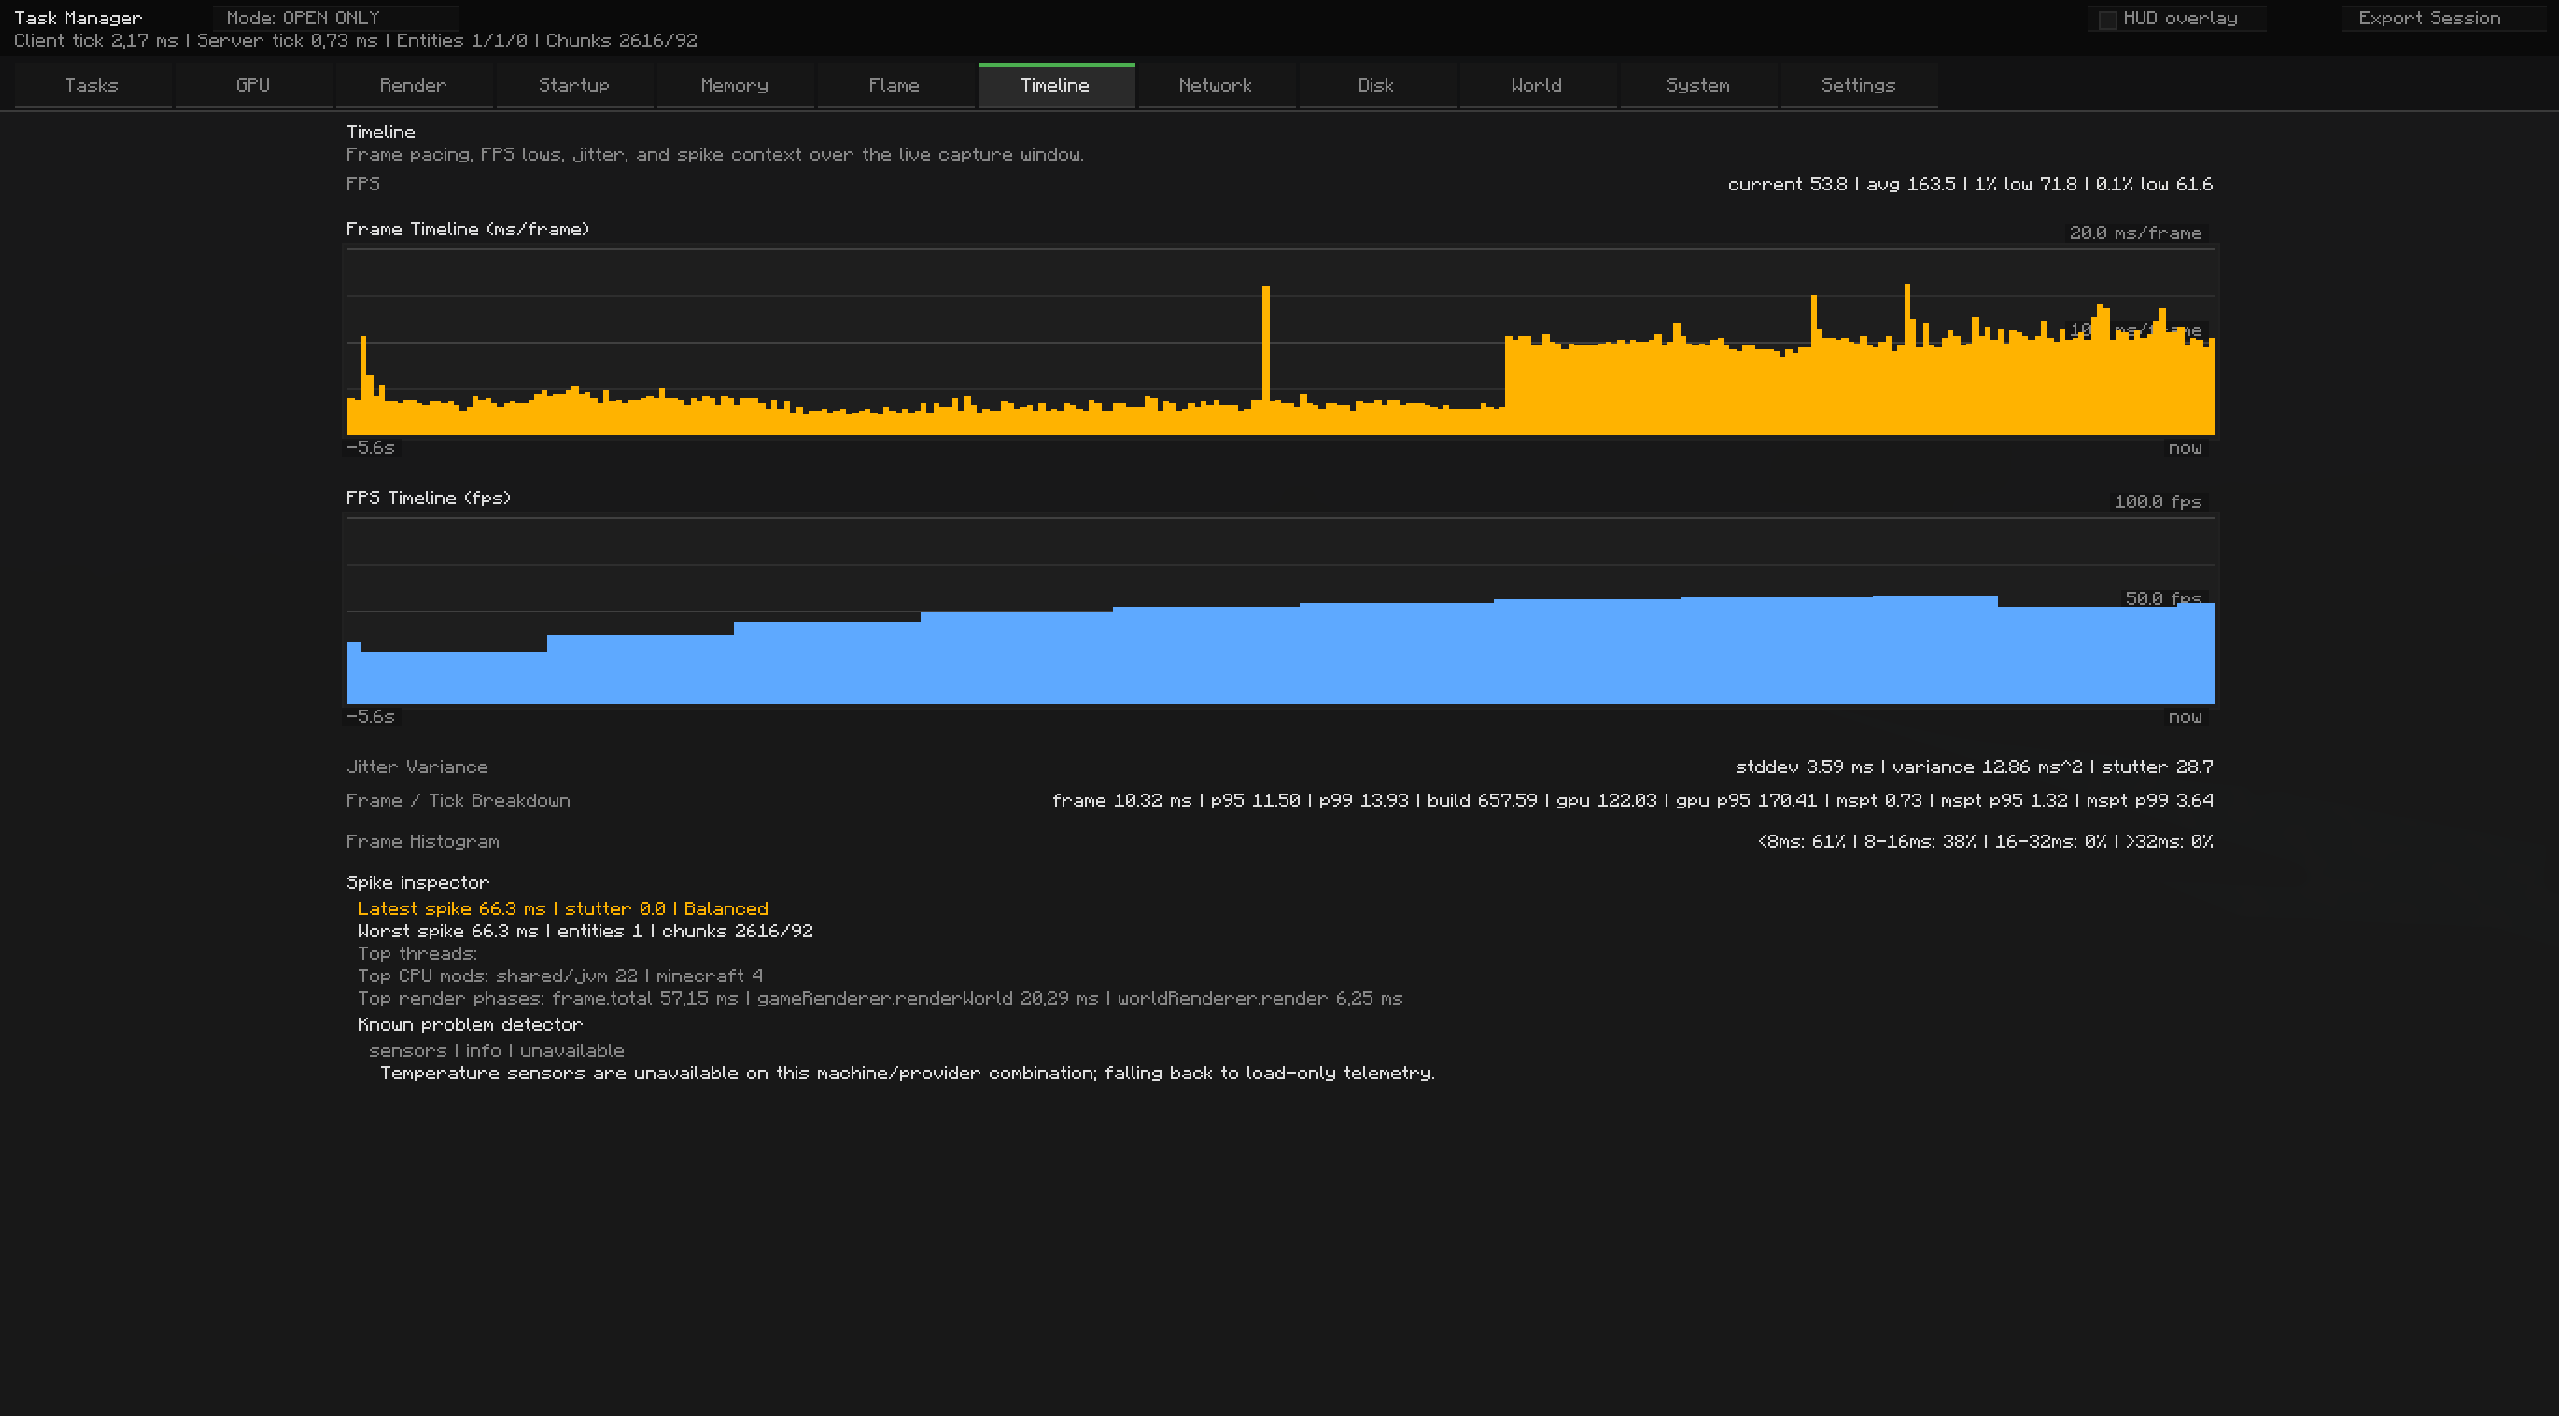 Task Manager Timeline
Versions
Files
Relations
Project Relations
More like this
Similar Mods
Suggestions use data such as tags, dependencies, dependents, descriptions, titles, and more to rank how much they overlap with this mod.
On ModDex
Community snapshot
By the numbers
Statistics
Want to reach Minecraft players?
We're looking for a server hosting partner to feature here and other parts of the site. Interested? Send us a message!
Get in touchGet it on
Available Platforms
On ModDex
Community snapshot
By the numbers